
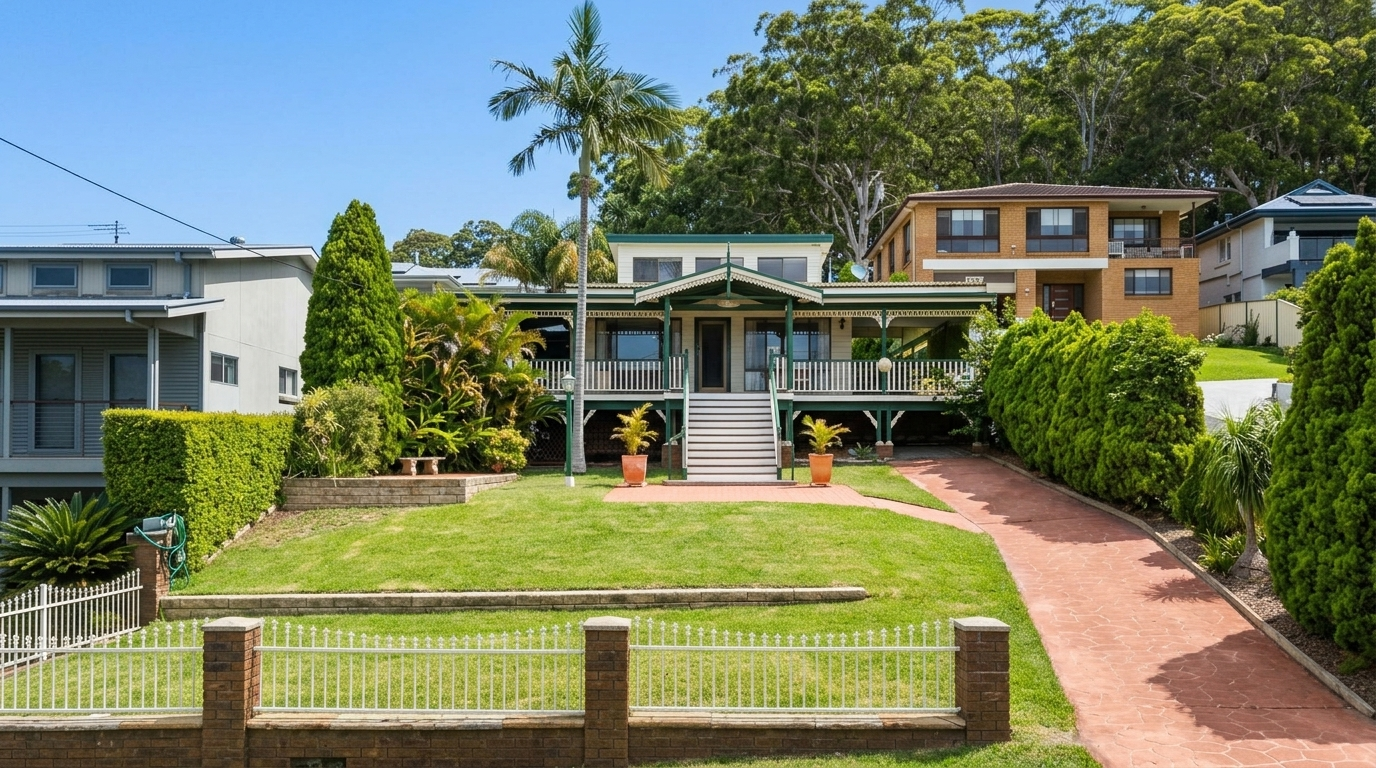
Every property investor faces the same fundamental question: do you chase strong rental cashflow today, or do you back capital growth to build wealth over the long run? In Blackwall, a compact waterfront pocket on the Central Coast’s Brisbane Water, that choice plays out across a surprisingly diverse market. Here, a two-bedroom unit can be picked up from around $570,000 and deliver a manageable rental income, while a deep-waterfront home on Orange Grove Road traded for $6.9 million in 2023, bought not for its yield but for its scarcity and long-term appreciation. Between these extremes sits a substantial middle ground of family homes where growth and income find a workable balance. Understanding which tier matches your goals is what separates a well-calibrated investment from a hopeful punt. This article walks through the numbers so you can make that call with confidence.
Blackwall at a Glance: The Market Context
Blackwall covers just 1.2 km² on the Woy Woy Peninsula, roughly 81 km north of Sydney and about a 15-minute drive from Gosford. It is overwhelmingly a house-and-townhouse suburb. The 2021 Census recorded 585 detached houses (roughly 65% of all private dwellings), alongside 188 semi-detached homes and townhouses, and only 21 flats. That housing mix shapes the investment landscape more than any other factor.
The demographic story is one of two distinct groups: downsizers and mid-life families. The median age sits at 45, with twin population peaks in the 40 to 49 and 60 to 69 brackets. These are people drawn to Blackwall because of the Brisbane Water lifestyle, where fishing and boating are described by local accommodation operators as “everyday activities” (HolidayCo), and the bushland trails of Blackwall Mountain Reserve. At the same time, the suburb is increasingly drawn into Sydney’s commuter orbit. Woy Woy Station is roughly a 7-minute drive away, with trains reaching Sydney CBD in about 70 to 75 minutes. That accessibility matters: it brings a steady pipeline of Sydney buyers seeking relative affordability, which underpins demand across every price point.
The Capital Growth Story
Blackwall’s long-term growth credentials are solid. AusPropertyInsights reports a 10-year compound annual growth rate (CAGR) of 6.9% and a 36-year CAGR of 6.3%, the kind of extended track record that signals consistency rather than a one-off boom. In dollar terms, HTAG records a 10-year price movement of 106.48%, meaning values have more than doubled in a decade.
More recently, the momentum has held. realestate.com.au reports 12-month house price growth of 8.0%, and property.com.au confirms an annual compound rate of 8.0% for houses. Importantly, AusPropertyInsights rates Blackwall at “fair value” as of early 2026, meaning prices are tracking their long-term trend rather than pulling ahead of it. For a long-term investor, that is a reassuring signal: you are not buying into overheated territory.
Blackwall also stacks up well against its neighbours. Woy Woy’s 10-year CAGR sits at 5.7%, while Umina Beach is at 7.6%, Ettalong Beach at 7.7%, and Empire Bay at 7.3%. Blackwall’s 6.9% places it competitively within the Peninsula, and its waterfront-scarcity premium, particularly along Orange Grove Road, is a feature inland suburbs do not share.
The Rental Yield Picture
If capital growth is Blackwall’s headline number, its rental yield is the footnote worth reading. RealEstateInvestar reports a house yield of 2.70%, while HTAG puts the gross yield at 2.06%. These are modest figures by any standard, and they sit below the Central Coast Gosford sub-region average of around 3% to 3.5%. That said, this is exactly what you would expect from a high-growth waterfront suburb: the appreciation does the heavy lifting, and the rent covers the holding costs.
The brighter side of the rental story is vacancy. At just 1.30%, Blackwall’s vacancy rate is well below the healthy benchmark of 2% to 3%. That points to genuine tenant demand. Rents are climbing, too: the median house rent now sits at $650 per week, up 18.18% year-on-year according to RealEstateInvestar. AreaSearch records a median rent of $611 per week in the first quarter of 2026, up 9.2% on the year. For townhouses, the median rent is $550 per week. With a quarter of Blackwall’s population renting, the tenant pool is deep enough to keep vacancies tight, and the rent growth trajectory suggests yields should continue improving as income outpaces price growth.
The Property-Type Spectrum: Where Yield Meets Growth
This is where Blackwall gets genuinely interesting for an investor: the choice of property type fundamentally reshapes the yield-versus-growth equation.
Premium waterfront: the growth-first play. Along Orange Grove Road, deep-waterfront homes with private jetties and boat sheds trade between $3.2 million and $6.9 million. Wilson’s Property describes the street as “arguably one of the premiere streets on the Central Coast,” where properties are “always tightly held.” The owner-occupier rate here runs at roughly 85%, meaning these are legacy assets rather than cashflow vehicles. Yields are low; buyers here are banking on capital preservation and long-term appreciation driven by genuine scarcity. There are only so many north-facing deep-waterfront blocks with direct Brisbane Water access on the entire Peninsula, and Blackwall has the best of them.
Mid-range houses: the balanced option. On streets like Gallipoli Avenue, Commonwealth Avenue, Warwick Street, and Memorial Avenue, established family homes on blocks typically between 480 m² and 700 m² trade from roughly $940,000 to $1,500,000. Recent sales bear this out: 48 Warwick Street changed hands at $950,000 in April 2026, 28 Commonwealth Avenue sold for $1,085,000 in February 2026, and 41 Gallipoli Avenue reached $1,175,000 in March 2026. These properties capture Blackwall’s 6.9% 10-year growth while offering a manageable rental return in the 2.70% range. For an investor with a medium-to-long horizon who wants capital growth without the extreme entry price of the waterfront, this is the natural home.
Townhouses and units: the yield-friendly entry. For investors who need cashflow to work from day one, Blackwall’s townhouse segment deserves a close look. Two-bedroom units have sold from $570,000 (2/11A Warwick Street, October 2024) up to $760,000 (2/10 Wallaby Street, April 2026). Three-bedroom townhouses range from $840,000 (1/56 Commonwealth Avenue) to $1.2 million (5/48 Gallipoli Avenue). With a townhouse median rent of $550 per week, the relative yield stacks up more favourably than houses, and the lower purchase price means lower holding costs and a smaller deposit. At 21% of all dwellings, townhouses are a meaningful and growing segment of the market, and the vacancy rate of 1.30% applies across the board.
Street-Level Nuances: Not All Growth Is Equal
Zoom in to street level and the picture sharpens further. AusPropertyInsights provides street-by-street median data that rewards close study.
Orange Grove Road stands alone with a median of $1,855,000 (roughly 1.6 times the suburb-wide median), reflecting the waterfront premium. For non-waterfront streets, Gallipoli Avenue leads with a median of $1,165,000, followed by Blackwall Road at $1,300,000. On a price-per-square-metre basis, the story shifts: Warrigal Street commands $4,337/m², the highest in the suburb, while Commonwealth Avenue sits at just $1,119/m², the lowest among Blackwall’s major streets. That lower land rate on Commonwealth Avenue, combined with block sizes around 500 m² to 700 m², points to a value proposition: solid family homes near the suburb median, on land priced attractively by the metre.
The practical takeaway is that an investor who understands Blackwall’s street-level data can dial in the precise growth-and-yield profile they want. Orange Grove Road for scarcity and prestige. Gallipoli Avenue and Blackwall Road for upper mid-range capital growth. Commonwealth Avenue for value on larger blocks. Warwick Street and Warrigal Street for townhouse-driven affordability and better relative yield.
Matching Strategy to Investor Profile
Which Blackwall investment is right for you depends entirely on what you need the property to do.
The growth-first investor with a five-to-ten-year horizon should look at mid-range houses on streets like Gallipoli Avenue, Blackwall Road, and Memorial Avenue. Accept a yield around 2.7% in exchange for the 6% to 8% annual growth Blackwall has consistently delivered. The structural demand case is sound: Sydney buyers continue to push into the Central Coast in search of value, and waterfront-adjacent land on the Peninsula is in fixed supply.
The yield-conscious investor who needs cashflow to service a loan should focus on townhouses in the Gallipoli Avenue, Warwick Street, and Warrigal Street clusters. Entry from $570,000 to $950,000 with rents of $550 to $650 per week produces a better income-to-price ratio than houses. The 1.30% vacancy rate protects that income, and the 18% year-on-year rent growth for houses suggests further upside as the rental market tightens across the region.
The lifestyle investor (someone who wants a long-term hold with personal-use appeal) will gravitate toward the Orange Grove Road waterfront or Bay View Crescent, where mountain and city views add another dimension to the value proposition. The 85% owner-occupier rate on Orange Grove Road tells you these are homes people buy to keep, not to trade, and that consistent demand supports prices through market cycles. With an average settlement time of 51 days according to AusPropertyInsights, Blackwall offers a reasonably liquid market across most segments.
The Bigger Picture: Central Coast Tailwinds
Blackwall does not operate in isolation. The Central Coast region is in what InvestorKit describes as a “gradual but improving recovery,” with the Gosford sub-region posting roughly 8.4% annual growth. The drivers are structural: Sydney’s median house price has pushed well past $1.5 million, which sends more buyers to the Coast; the upgraded Central Coast & Newcastle Line makes a 70-to-75-minute train commute feasible for hybrid workers who only need to be in the office two or three days a week; and Gosford’s CBD revitalisation is gradually expanding the local employment base. The RBA’s rate-cutting cycle, which began in early 2025, is expected to support a steady recovery through 2026 and 2027.
Within that regional story, Blackwall occupies a distinct niche. It offers the waterfront lifestyle that Woy Woy (its larger, more serviced neighbour to the north) cannot match, while remaining more affordable than the deep-waterfront enclaves further south. The suburb works as a quiet residential village with boating and bushland amenity, and it sits within Sydney’s extended commuter belt. That combination is uncommon on the Central Coast.
Conclusion
Blackwall rewards investors who know what they are buying and why. There is no single right answer to the yield-versus-growth question here; the suburb spans a wide enough range of property types, streets, and price points that both the growth-focused buyer and the cashflow-conscious investor can build a case.
The premium waterfront on Orange Grove Road is a growth play backed by genuine scarcity. Mid-range houses on Gallipoli Avenue, Blackwall Road, and Commonwealth Avenue deliver a balanced mix of long-term appreciation and manageable rental return. And the townhouse segment, clustered around Warwick Street, Warrigal Street, and Gallipoli Avenue, offers the most yield-friendly entry point for investors who need income to lead the equation.
What ties all three tiers together is the suburb’s underlying strength: a consistent, decades-long growth record; a rental market tightening by the year; and a location that combines Brisbane Water’s lifestyle appeal with genuine Sydney commuter access. Whether your priority is capital growth, rental income, or a blend of both, Blackwall gives you the data, and the choice, to invest on your own terms.
Frequently Asked Questions
Is Blackwall a good suburb for property investment in 2026?
Blackwall presents a compelling investment case in 2026. Its 10-year compound annual growth rate of 6.9% demonstrates consistent long-term appreciation, and AusPropertyInsights currently rates the suburb at fair value, meaning prices are aligned with long-term trends, not overheated. The vacancy rate sits at a tight 1.30%, rents have risen 18.18% year-on-year, and the suburb benefits from the broader Central Coast recovery driven by Sydney buyers seeking relative affordability. Blackwall’s waterfront position on Brisbane Water adds a scarcity premium that sets it apart from inland suburbs, particularly along Orange Grove Road where properties are tightly held and rarely trade.
What rental yield can I expect from a Blackwall investment property?
House yields in Blackwall sit at around 2.70%, with gross yields of approximately 2.06%. These figures are below the Central Coast Gosford sub-region average of 3% to 3.5%, which is typical for a high-growth waterfront market where capital appreciation does the heavy lifting. However, the trend is improving: median house rents have climbed 18.18% over the past year to $650 per week, outpacing price growth. Townhouses, with a median rent of $550 per week and lower entry prices from $570,000, generally offer a better yield-to-price proposition. With a vacancy rate of just 1.30%, rental income is well-protected.
Which streets in Blackwall offer the best capital growth?
Orange Grove Road is Blackwall’s premier capital-growth strip, with a street median of $1,855,000 and waterfront homes trading between $3.2 million and $6.9 million. Its deep-water access, private jetties, and tightly held nature create strong scarcity value. Wilson’s Property describes homes here as “always tightly held.” For non-waterfront growth, Gallipoli Avenue (median $1,165,000) and Blackwall Road (median $1,300,000) lead the mid-range. On a price-per-square-metre basis, Warrigal Street commands $4,337/m², the highest in the suburb, which points to strong demand for its townhouse product.
Are townhouses in Blackwall a better investment than houses?
It depends on your strategy. Townhouses offer a lower entry price (from $570,000 for a two-bedroom unit to about $1.2 million for a three-bedroom townhouse), compared to $940,000-plus for an entry-level detached house. With a median townhouse rent of $550 per week, the yield-to-price ratio is generally stronger. Townhouses also benefit from the same 1.30% vacancy rate and growing rental demand. The trade-off is land content: houses on 480 m² to 700 m² blocks capture more of the suburb’s long-term capital growth. For cashflow-conscious investors, townhouses are Blackwall’s clear sweet spot; for those prioritising 10-to-20-year appreciation, a house on a solid block remains the stronger bet.
How does Blackwall compare to nearby suburbs like Woy Woy or Ettalong Beach for investment?
Blackwall’s 10-year CAGR of 6.9% compares well against Woy Woy (5.7%), sits slightly behind Ettalong Beach (7.7%) and Umina Beach (7.6%), and leads Empire Bay (7.3%). Where Blackwall differentiates itself is in its residential character: it is quieter and less commercially serviced than Woy Woy or Ettalong Beach, which for some tenants and buyers is exactly the appeal. The Orange Grove Road waterfront commands a premium that has no direct equivalent in Woy Woy. That gives Blackwall a high-end growth segment not found in nearby suburbs. For an investor, Blackwall offers the Peninsula lifestyle with a more village-like feel.
What drives property demand in Blackwall?
Demand in Blackwall is fuelled by a combination of lifestyle and accessibility. The Brisbane Water foreshore provides boating, fishing, and a public boat ramp, while Blackwall Mountain Reserve offers bushland walking trails and panoramic lookouts. The suburb is a roughly 7-minute drive from Woy Woy Station, with trains reaching Sydney CBD in 70 to 75 minutes, a viable commute for hybrid workers. Compared to Sydney’s median house price north of $1.5 million, Blackwall’s mid-range homes in the $940,000 to $1.5 million bracket represent relative value. The 1.30% vacancy rate confirms that rental demand is strong and sustained.
Is now a good time to buy in Blackwall, or should I wait?
Current indicators suggest conditions are favourable for buyers with a medium-to-long-term view. AusPropertyInsights rates the market at fair value, meaning prices are not running ahead of fundamentals. The RBA’s rate-cutting cycle, which began in early 2025, is improving borrowing capacity, and the Central Coast is in a recovery phase that is expected to continue into 2027. With 12-month house price growth of 8.0% and a 10-year track record of 6.9% annual growth, Blackwall has demonstrated consistent momentum. The structural driver (Sydney buyers seeking affordability on the Coast) shows no sign of reversing.
What type of tenant rents in Blackwall?
With a rental population of 25.75%, Blackwall’s tenant base includes downsizers who have sold the family home but want to stay on the Peninsula, mid-life families priced out of purchasing, and professionals who commute to Sydney or Gosford. The lifestyle appeal (waterfront access, bushland, and a peaceful residential setting) attracts tenants who value amenity over proximity to a cafe strip. The 1.30% vacancy rate and 18.18% year-on-year rent growth signal that demand consistently outstrips supply across this tenant mix.
How much deposit do I need for a Blackwall investment property?
Entry-level two-bedroom units in Blackwall have sold from $570,000, while entry-level houses start around $940,000. A standard 20% deposit, avoiding lenders mortgage insurance, would mean roughly $114,000 for the most affordable unit and $188,000 for an entry-level house. Townhouses in the $750,000 to $950,000 range sit in between. Blackwall’s wide price spectrum means investors can match their deposit capacity to the property tier that best suits their strategy, whether that means a lower-entry townhouse for better cashflow or a mid-range house for long-term growth.
Does Blackwall suit a positively geared investment strategy?
Positive gearing is challenging across much of Blackwall given headline house yields of 2.70% and current interest rates. However, townhouses and units offer a more viable path. Using property.com.au’s 2-bedroom unit median rent of $570 per week, a $570,000 two-bedroom unit produces a gross yield of around 5.2% before costs, which is far closer to neutral or positive territory than a house at 2.70%. With rents rising strongly (up 18.18% for houses over the past year), the cashflow equation is improving across all property types. An investor prioritising positive gearing should focus squarely on the townhouse and unit segment.
What infrastructure or development is planned that could affect Blackwall property values?
Several Peninsula and Central Coast initiatives affect Blackwall property values. The Woy Woy Foreshore Masterplan aims to enhance the waterfront amenity of the area’s main service hub, while the Central Coast Regional Plan 2041 provides the overarching strategic framework for growth across the region. Gosford’s CBD revitalisation, ongoing upgrades to the Central Coast & Newcastle Line, and general Peninsula infrastructure investment all support long-term demand and liveability. While Blackwall itself is largely built out (with infill townhouse and duplex development on individual lots the primary form of change), improvements to surrounding amenity feed directly into property values.
Who buys in Blackwall: investors or owner-occupiers?
Blackwall skews owner-occupier. Overall, roughly 75% of dwellings are owner-occupied, and on Orange Grove Road that figure climbs to approximately 85%. The buyer mix includes downsizers drawn to the quiet waterfront lifestyle, families seeking larger blocks than they could afford in Sydney, and a growing cohort of Sydney professionals who work remotely part of the week. Investors make up the balance, attracted by the combination of consistent long-term capital growth, a tight 1.30% vacancy rate, and rising rents. The strong owner-occupier presence supports price stability and reinforces the suburb’s well-maintained, community-oriented character.
This article is for general informational purposes only and does not constitute financial, investment, or property advice. All data is sourced from publicly available records and third-party platforms as cited. Past performance is not indicative of future results. Always seek independent professional advice before making property or financial decisions.