
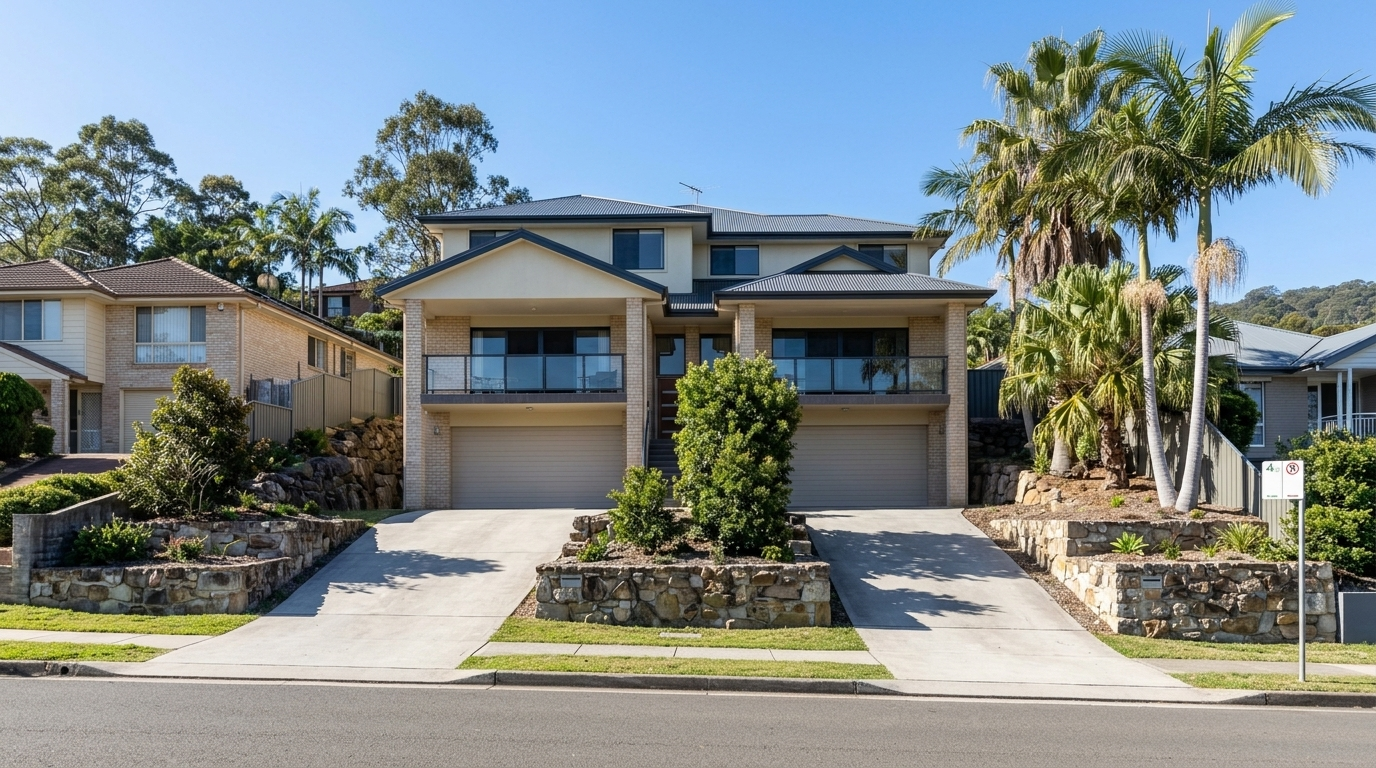
A townhouse in Blackwall can sell for under $600,000. On the same suburb’s waterfront, a deep-waterfront home might trade for nearly $7 million. That wide range, in a peninsula suburb of just 1.2 square kilometres, makes the question of “what does property cost here?” harder to answer than in most places.
The median is where buyers and sellers start. But in Blackwall, where the market spans three distinct tiers, a single number can only tell you so much. Here’s what the median actually means, what Blackwall’s recent numbers reveal, and how to read beyond the headline figure.
What Is a Median, Really?
The median is not an average. It is the middle sale when every transaction is lined up lowest to highest. If five homes sold for $500,000, $520,000, $540,000, $900,000, and $1.1 million, the median is $540,000, even though the average would be pulled above $700,000.
This resistance to distortion is why the median is the most commonly used price measure. A single $6.9 million waterfront sale cannot hijack the median the way it would an average. It tells you where half of buyers spent more and half spent less.
But the median has blind spots. It cannot tell you what kind of property that middle sale was, how long properties sat on the market, or whether volumes are rising or falling. As Adviseable puts it, the median is a starting point, not a decision-maker.
Blackwall’s Median: Which Number Is the Right One?
Different platforms, different numbers. All technically correct.
Realestate.com.au reports a median house price of $1,215,000 for the 12 months to mid-2026. Domain splits by property type: $1.19 million for houses and $840,000 for units. AusPropertyInsights reports $1,012,500 across all types, $1,187,500 for houses, and $792,500 for units. AreaSearch puts the 2026 year-to-date figure (spanning roughly seven months of settlements) at $1,000,000 overall and $1,150,000 for houses.
The NSW Valuer General’s all-time median of $685,000 across 537 sales back to the early 2000s is accurate historically but tells you nothing about today’s market.
Each platform uses a different time window, inclusion criteria, and property-type grouping. The most useful reference for most buyers: $1,150,000 to $1,215,000 for a typical house, based on the most recent 12 to 18 months.
The Price Spectrum: Why One Number Cannot Capture Blackwall
The median sits in the middle, but Blackwall’s market is anything but a single story. The suburb breaks naturally into three tiers, each with its own buyer profile and price expectations.
Tier 1: Entry-level units and townhouses ($570,000 to $760,000). Where first-home buyers and downsizers find their footing. A two-bedroom unit at 2/11A Warwick Street sold for $570,000 (October 2024), 17/2 Dunmore Street for $685,000 (February 2026), and 2/10 Wallaby Street for $760,000 (April 2026). These are modest, low-maintenance homes showing that Blackwall is accessible well below the headline median.
Tier 2: Standard houses on typical blocks ($940,000 to $1,500,000). The band the median actually describes. Recent sales: 48 Warwick Street ($950,000, April 2026), 79 Memorial Avenue ($955,000, December 2025), 311 Blackwall Road ($1,050,000, February 2026), 26 Springwood Street ($1,150,000, May 2026), and 41 Gallipoli Avenue ($1,175,000, March 2026). Three- and four-bedroom detached homes on 450 to 550 m² blocks, the most common type of home in Blackwall.
Tier 3: Premium and deep-waterfront ($1.75 million to $6.9 million). Along Orange Grove Road the numbers change entirely. 11A Bay View Crescent sold for $1,750,000 (mid-2024), 373 Orange Grove Road for $2,400,000 (February 2025), and 464 Orange Grove Road for $4,400,000 (March 2024). At the top, 472 Orange Grove Road (deep-water frontage, private jetty) sold for $6,900,000 (March 2023).
The median, squarely in Tier 2, represents a three-bedroom house on a standard block. It does not represent the first-home buyer shopping for a unit or the buyer inspecting Orange Grove Road waterfronts. Each tier is its own market.
Beyond the Median: Volume, Days on Market, and Growth
A sale-price figure only comes into focus alongside other numbers.
Sales volume: WhichAgent recorded 97 sales in Blackwall in the 12 months to mid-2026, roughly eight per month. That is low turnover, characteristic of a tightly held market. Month-to-month median swings are statistically noisy; the annual figure is the one to watch.
Days on market: Houses in Blackwall averaged 73 days according to WhichAgent, while RealEstateInvestar reports 145 days. The gap likely reflects differences in listing-to-settlement methodology. Either way, this is not a “snap it up by Saturday” suburb. It suits considered purchasing.
Growth rates: Three independent platforms converge tightly around 7.8% to 8.0% annual house price growth for Blackwall. Realestate.com.au and Property.com.au both report 8.0%, while Your Investment Property puts it at 7.78%. Over 10 years, the compound annual growth rate sits at 6.9% according to AusPropertyInsights, and HTAG records a total 10-year movement of 106.48% (values have more than doubled in a decade). Steady, consistent appreciation over time.
Rental market: AreaSearch reports a median rent of $611/week (Q1 2026), up 9.2% year-on-year, with vacancy at 1.30%. Rental yields sit around 2.7% for houses according to RealEstateInvestar, consistent with a market where capital appreciation rather than cash flow has driven investment. Tight rentals support owner-occupier demand, which supports prices.
Altogether: steady growth, low churn, and a market where patient buyers can take their time.
Street by Street: Why Micro-Location Drives Price
Two streets 300 metres apart in Blackwall can have medians more than $700,000 apart.
Orange Grove Road, tracing the Brisbane Water foreshore, has a median of $1,855,000, nearly double the suburb-wide figure. Deep-water access, private pontoons, and wide views across to Gosford set the pricing here.
Gallipoli Avenue sits at $1,165,000, solid mid-range: a mix of mid-century homes, updated cottages, and newer villa developments on level, family-friendly blocks. Blackwall Road is at $1,300,000, benefiting from larger blocks. Warwick Street tells a different story at $752,500, skewed by its concentration of townhouse and unit stock.
The takeaway: when buying or selling, the suburb-wide median is reference material. The street-level comparable (recent sales of the same property type within 500 metres) is the real benchmark.
Putting It All Together
Blackwall in mid-2026 is a market of three segments, with the median ($1.15 million to $1.2 million) representing the middle: standard houses on typical blocks. It is steady, not frantic. Growth hovers in the mid-to-high single digits, and AusPropertyInsights assesses the suburb as near its long-term fair-value trend.
Tight rental conditions (1.3% vacancy, rising rents) combined with limited supply and low turnover support continued demand for housing.
For buyers, the spread means opportunity at every level, from entry-level units below $600,000 to premium waterfront above $1.75 million. Match your budget to the right tier, not the headline median.
For sellers in the standard house tier, the median is a realistic starting point, but micro-location and presentation determine where in the range your property lands.
Conclusion
The median is the best single starting point, but in Blackwall it masks considerable diversity, from modest units to multimillion-dollar waterfront estates often within walking distance of each other. Three habits will serve you better than any headline figure: filter by property type, zoom to street level, and check volume and days on market alongside price.
Frequently Asked Questions
What is the current median house price in Blackwall, NSW?
The most reliable range for a typical house in Blackwall is $1,150,000 to $1,215,000, based on the most recent 12 to 18 months of data from Realestate.com.au, Domain, and AreaSearch. The NSW Valuer General’s all-time median of $685,000 blends 537 sales spanning back to the early 2000s; it is accurate historically but not reflective of today’s market in Blackwall.
Why do different websites show different median prices for Blackwall?
Each platform uses a different time window (three months, 12 months, or all-time), different inclusion rules (auction results only, all listings, or settled sales), and different property-type groupings. A site mixing houses and units into one Blackwall median will report a lower figure than a house-only number. Every figure is correct within its own methodology. The key is picking a consistent source and sticking with it.
Does Blackwall’s median include the multimillion-dollar Orange Grove Road waterfront properties?
Yes, every sale in Blackwall within the reporting period contributes to the median. But because the median takes the middle value rather than the average, a small number of $4 million-plus sales do not pull it upward as dramatically as they would an average price. That said, Orange Grove Road’s street-level median of $1,855,000 is nearly double the suburb-wide figure, so the presence of premium waterfront stock does influence the number, just less than you might expect.
What is the difference between median price and average price, and which is more useful in Blackwall?
The median is the middle sale when all prices are ranked lowest to highest. The average is the sum divided by the count. In Blackwall, a single $6.9 million waterfront sale would distort the average far more than the median. The median is the most commonly used measure because it resists outliers and better reflects what a typical buyer spends.
How many sales does it take for a median to be reliable in Blackwall?
Low-sale-count periods produce volatile medians. Blackwall’s 97 sales over 12 months (roughly eight per month) is enough for a stable annual median but not enough to read much into month-to-month swings. A single waterfront sale in a quiet month could nudge the median without signalling any real change in conditions.
Is Blackwall’s median house price going up or down?
The clearest recent signals point upward. Three major platforms (Realestate.com.au, Property.com.au, and Your Investment Property) all report annual house price growth between 7.78% and 8.0% for Blackwall. Over the past decade, Blackwall prices have more than doubled (a 106.48% total increase), and AusPropertyInsights assesses the suburb as being near its long-term fair-value trend.
If the median is around $1.15 million, can I still buy something in Blackwall for under $800,000?
Yes, but it will be a unit or townhouse, not a detached house. Recent two-bedroom unit sales include $570,000 at 2/11A Warwick Street (October 2024), $685,000 at 17/2 Dunmore Street (February 2026), and $760,000 at 2/10 Wallaby Street (April 2026). The median only tells you the midpoint of the market; the segment below it is real and accessible for buyers focused on units and townhouses in Blackwall.
How do unit and townhouse medians compare to house medians in Blackwall?
The unit median across platforms ranges from roughly $792,500 to $840,000, about two-thirds of the house median. Townhouses occupy the gap between units and houses, with recent sales in the $840,000 to $1,200,000 range depending on size and location. The property-type split is critical: mixing units and houses into one Blackwall-wide median produces a figure that does not accurately represent either.
What other data should I look at besides the median when researching Blackwall?
Days on market (73 to 145 days for houses), sales volume (roughly eight per month), rental yield (around 2.7% for houses), vacancy rate (1.30%), and street-level comparables all add context. Recent comparable sales (same property type, same street or within 500 metres) are the most actionable benchmark for any specific property in Blackwall.
How often is Blackwall’s median price updated, and should I check it regularly?
Most platforms update monthly or quarterly. Checking quarterly is sufficient for tracking broad trends. If you are actively buying or selling in Blackwall, focus on the most recent three to six months of comparable sales on your target street. That real-time data tells you more than any suburb-wide median.