The Australian housing market has been well and truly booming for the best part of the last decade. In 2021 alone, house prices across the country rose by 25.2% – largely underpinned by record-low interest rates and government stimulus.
Over the last six months, however, we have begun to witness a change in the tide.
At their July meeting, the Reserve Bank of Australia (RBA) increased the cash rate for the third consecutive month by another 50 basis points. From a record low of 0.1%, the official cash rate now sits 125 basis points higher at 1.35% – and we’re likely to see this steadily rise over the course of this year and into 2023.
Although the rate hikes are aimed at curbing inflation, higher rates are a handbrake for the property market as buyer affordability is constrained. While housing values are continuing to rise month on month in some capital cities, the decline in Sydney, Melbourne and now Hobart kept the Core Logic five capital city aggregate for growth in the red during June (-0.9%), a figure that speaks directly to the changing of the tide.
As we move into a cycle of rate hikes, we are likely to see the trend of falling house prices become more widespread. For now, there’s a fairly different story for each state. Let’s take a closer look at what’s happening in our key markets:
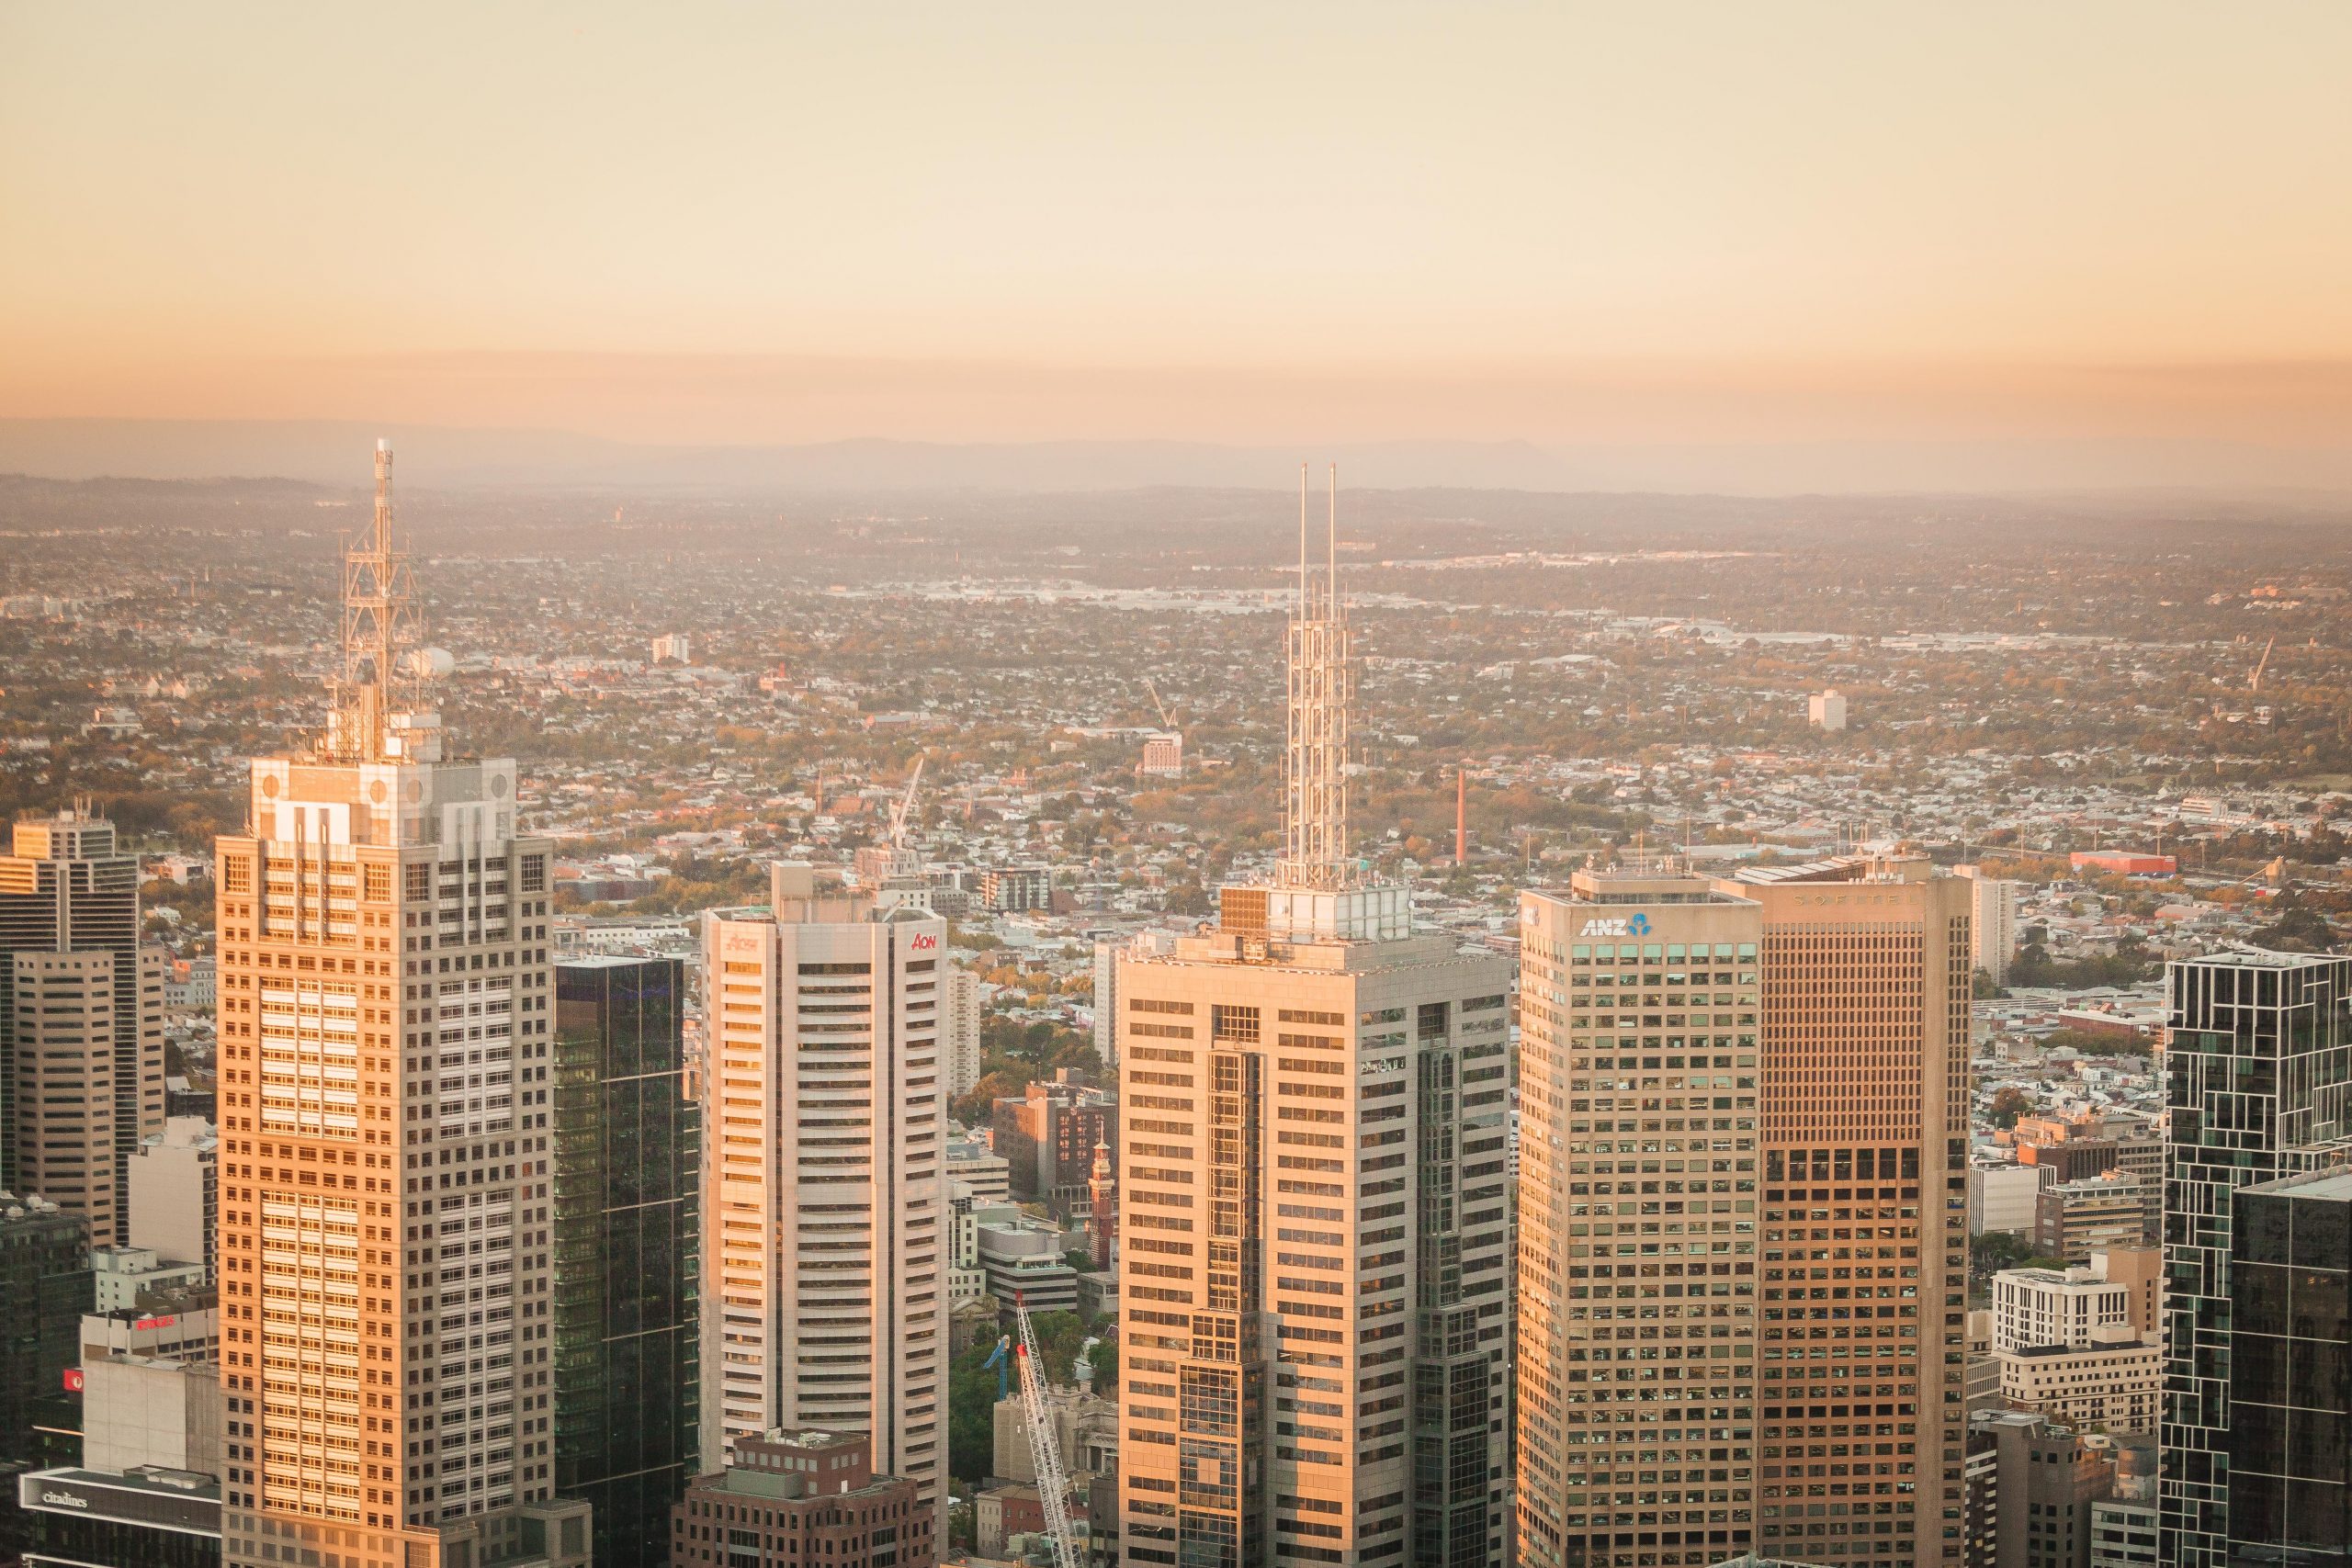
Sydney
Just as the Sydney market set the stage in recent years for house price growth across the country, the decline in house values over the last six months is a sign of what’s to come. In the June quarter, Sydney saw another growth stall by -2.8%. This is in stark contrast to a peak rate of growth (5.9%) during the same period last year. However, it is important to note that while we have potentially passed the peak in terms of growth, prices remain incredibly strong and still exceed 20% above pre-Covid levels.
Melbourne
It’s a fairly similar story in Melbourne – remarkably strong growth over the past two years has stalled. After peaking in the three months leading up to April last year with 5.8% growth, in the three months leading up to June this year, Melbourne saw growth decline by -1.8%. A combination of rising interest rates and inventory levels that are higher than they were 12 months ago has contributed to house prices falling in five of the last six months.
Canberra
In the second most expensive property market behind Sydney, after three years of steady growth, Canberra recorded its first monthly decline (-0.1%) since 2019 in May. This decrease, while marginal, coupled with the lowest auction clearance rate since 2020 (67.9%) points to the Canberra market beginning to lose steam. For now, however, housing values still remain upwards of 30% higher than pre-pandemic levels.
Brisbane
The fastest-growing capital city market, Brisbane, recorded the steepest annual rate of growth in 2021, up 32.1%. With stock levels well below the five-year average, month-on-month growth remains steady despite moving past the peak rate of growth. In the three months leading up to June, Brisbane recorded 2.7% growth compared to a peak in the December quarter last year of 8.5% growth.
Adelaide
Like Brisbane, the Adelaide market is benefitting from consistently low levels of stock and better affordability than the likes of Melbourne and Sydney. While the upswing has lost steam compared to last quarter, in the three months leading to June, Adelaide recorded 5.1% growth.
As interest rates continue to rise, the market will move into a correctional phase. We will see growth across the country steady and slowly decline. However, any depreciation will be unlikely to wipe out the significant gains made in the property market in the last few years.
For additional market insights specific to your area, please contact your nearest Stone office, or click here to download a free copy of your property report.