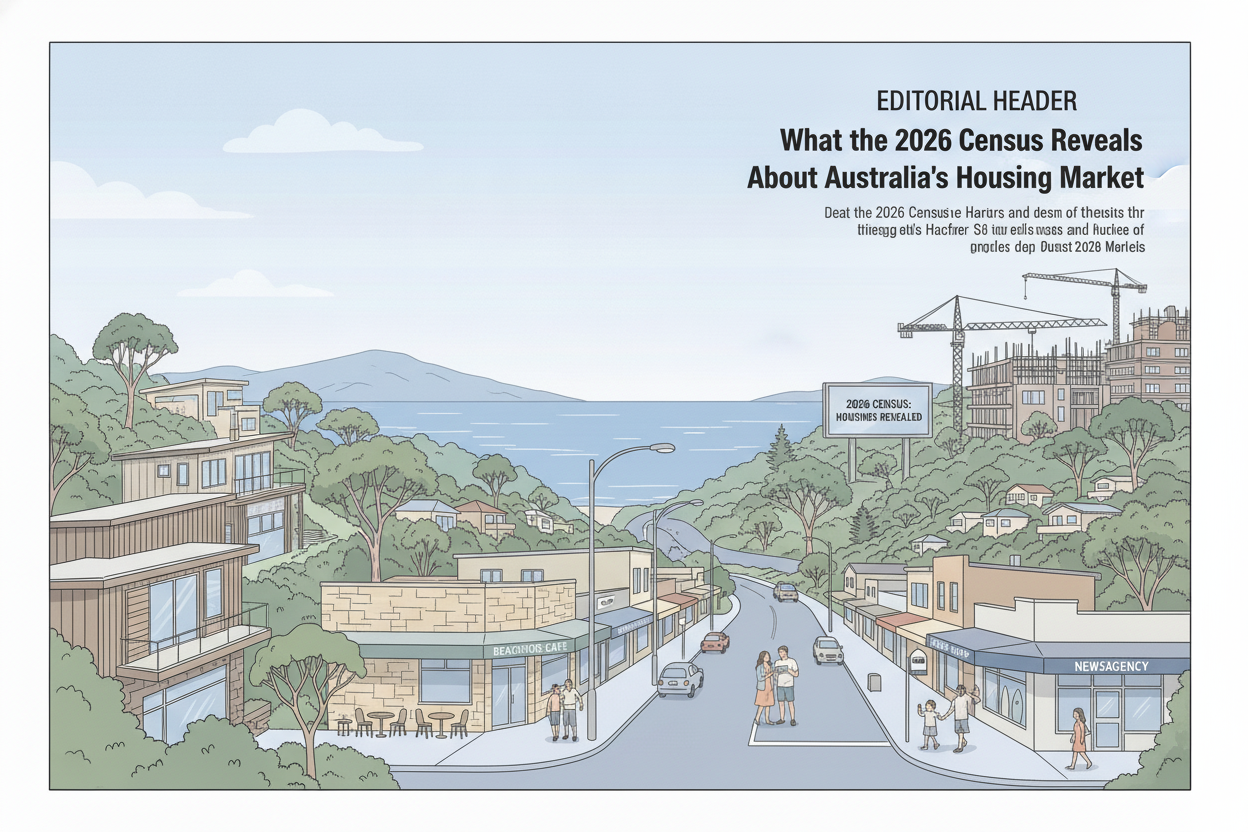
Tonight, millions of Australian households are filling out the census. The last snapshot came in August 2021, mid-lockdown, when borders were closed and the property boom was still gathering steam. Five years later, the landscape looks different: three RBA rate hikes in 2026, a federal budget that rewrote the rules on property investment, and a national housing market valued at $12.77 trillion that is beginning to fragment along city lines. The actual housing data will not land until June 2027. But what the census asks, what pre-release research already tells us, and what experts are watching for paint a revealing picture.
What the Census Actually Asks About Housing
The household form puts four housing questions on the table: number of bedrooms; tenure (owned outright, mortgaged, shared equity, rented, rent-free, life tenure); landlord type for renters (real estate agent, public housing, community housing, relative, employer, or residential park manager); and the amount the household pays for the dwelling, reported weekly, fortnightly, or monthly.
The ABS is specific about that payment figure. Water rates, council rates, body corporate fees, repairs, and maintenance are all excluded. Only rent or mortgage repayments count. After collection, the ABS standardises mortgage payments into monthly amounts and rent into weekly amounts, making suburb-by-suburb comparisons possible. Shared equity purchases are recorded separately from standard mortgages, so the 2026 data will offer a more detailed tenure picture than before.
Home Ownership in Retreat
Sydney’s owner-occupier rate has fallen to 59.9%, the lowest since the 1950s, according to KPMG analysis released ahead of the census. The national rate has slipped from 66.3% in 2021 to an estimated 65.9% in 2025. NSW is doing the bulk of the dragging.
Not every state is moving backward. WA improved from 69.2% to 69.9%, Queensland edged up, and Victoria held steady. But Sydney dominates the story. Greater Sydney added more than 83,000 renter households between 2021 and 2025, an 11.8% increase. Nearly two in five city households now rent, and Sydney’s median rent reached $800 per week in June 2026, with houses at $850.
The generational divide is widening. At the 2021 count, only 55% of Millennial households aged 25 to 39 owned a home, compared to 62% of Gen X and 66% of Baby Boomers at the same age. Outright ownership fell to 31%, down from over 40% in 1996. Dr Francesca Perugia, Senior Lecturer in Urban and Regional Planning at Curtin University, is watching for older Australians entering retirement while still carrying mortgages or facing rental insecurity. “We have a growing group of the population that is reaching retirement, and there’s a growing number of people renting or still having mortgages when income is declining,” she said.
A Fractured National Market
Australia no longer has one housing market. National house prices fell 0.3% in June 2026, but the headline obscures a country pulling in different directions. Capital cities drove the decline (down 0.4%) while regional areas held flat at record highs.
The Reserve Bank lifted the cash rate in February, March, and May 2026, returning it to 4.35%, its 2024 peak, and progressively eroding buyer borrowing capacity. Sydney and Melbourne are feeling it most. KPMG forecasts house price falls of 4.4% in Sydney and 5.0% in Melbourne for 2026, driven by rate sensitivity and the May 2026 federal budget changes to capital gains tax and negative gearing. KPMG Chief Economist Dr Brendan Rynne described a “V-shaped trajectory”: a correction this year followed by a gradual recovery in 2027, as underlying supply shortages reassert themselves.
Perth, Brisbane, and Adelaide posted strong annual gains, though the pace is cooling quickly. Perth’s median slipped 0.5% in June, its second consecutive monthly decline, after a five-year boom that nearly doubled prices. Annual growth remains positive at 17.1%, with KPMG forecasting 6.4% for houses in 2026. Brisbane sits at 4.6% and Adelaide at 5.3%. Darwin is forecast as Australia’s strongest market at 8.2% for houses, supported by rental yields and major project activity.
The total value of Australian dwellings reached $12.77 trillion in the March quarter 2026, with the mean home price surpassing $1.1 million for the first time. The national median dwelling value sat at about $940,048 in May 2026. Growth is decelerating, and the census captures the market right as that shift accelerates.
The Supply Gap and the Household Formation Wildcard
AMP chief economist Shane Oliver estimates a cumulative dwelling deficit of 200,000 to 300,000 homes. Net overseas migration reached roughly 420,000 in the year to September 2025, outstripping new home completions by about three to one. A record 243,900 dwellings were under construction in the March quarter 2026.
The National Housing Supply and Affordability Council projects only about 980,000 new homes will be delivered in the five-year National Housing Accord period to mid-2029, against a 1.2 million target. That is a shortfall of roughly 262,000 dwellings.
Then there is household formation. Between 2016 and 2021, the average Australian household shrank from 2.6 to 2.5 people. That 0.1 shift alone created demand for roughly an extra one million dwellings. Property investor James Fitzgerald calls it “a quieter number that matters more”. Single-person households climbed from 24.4% to 25.6%. If the 2026 Census shows further shrinkage, housing demand will be structurally higher than population figures alone suggest.
First-home buyer loans rose from 117,200 to 120,500 in the year to March 2026, but one in four reports a lack of listed properties, not just price, is holding them back.
What to Watch When the Numbers Land in June 2027
The first data release in June 2027 will deliver tenure, landlord type, housing costs, mortgage and rent affordability, dwelling structure, and bedrooms. QuickStats will make suburb and postcode comparisons possible.
Three numbers are worth watching. First, whether household formation shrank further, revealing structurally higher demand than the population count suggests. Second, the share of Australians aged 65 and over still carrying mortgages or renting. Third, overcrowding metrics and the new shared equity tenure category, which will show whether alternative pathways to ownership are gaining traction.
The census will not capture everyone. Mining communities including Kalgoorlie-Boulder argue that FIFO workers who spend most of their time in town but list their primary residence elsewhere create “ghost populations” that distort infrastructure funding. The ABS uses a “usual residence” test requiring six months or more at a location, which regional councils say undercounts the strain on local services.
By June 2027, market conditions will have moved on. KPMG’s forecast already anticipates a recovery by then. The census is a benchmark, not a forecast, and it will let every household, policymaker, and market participant measure how far the housing story has moved.
Frequently Asked Questions
When will 2026 Census housing data be released?
The ABS plans to release most housing topics in the first data release in June 2027. That includes tenure, landlord type, housing costs, mortgage and rent affordability, dwelling structure, and bedrooms. A second release follows in October 2027 and a third in early to mid-2028. The first release will include QuickStats for suburbs, postcodes, and local government areas. (ABS 2026 Census Topics and Data Release Plan)
What housing questions does the 2026 Census ask?
The household form asks four housing questions: how many bedrooms are in the dwelling; whether it is owned outright, mortgaged, under a shared equity scheme, rented, occupied rent-free, or held under a life tenure arrangement; who the dwelling is rented from (real estate agent, public housing, community housing provider, relative, other private landlord, employer, or residential park manager); and how much the household pays, reported weekly, fortnightly, or monthly. The payment amount excludes water rates, council rates, body corporate fees, repairs, and maintenance.
How has Australian home ownership changed since the 2021 Census?
The national owner-occupier rate dropped from 66.3% in 2021 to an estimated 65.9% in 2025. Sydney recorded the sharpest decline, falling to 59.9%, the lowest since the 1950s. Greater Sydney added more than 83,000 renter households between 2021 and 2025, an 11.8% increase. WA and Queensland improved, and Victoria held steady. The generational gap is widening: only 55% of Millennials owned a home at the 2021 count, compared to 62% of Gen X and 66% of Baby Boomers at the same age.
Which Australian cities have the strongest housing markets in 2026?
Darwin is forecast to be the strongest-performing capital city in 2026, with KPMG projecting house price growth of 8.2%. Perth follows at 6.4%, Adelaide at 5.3%, Brisbane at 4.6%, and Hobart at 4.8%. Sydney and Melbourne are expected to see house price declines of 4.4% and 5.0% respectively, weighed down by rate sensitivity, affordability constraints, and changes to property investment taxation in the May 2026 federal budget.
How does the Census measure housing affordability?
The Census collects self-reported rent and mortgage payment data from every household. The ABS standardises mortgage payments to a monthly figure and rent to a weekly figure, enabling suburb-by-suburb comparisons. The ABS then derives affordability indicators from these standardised amounts combined with income data. The 2026 product guide confirms QuickStats will include monthly mortgage repayments, weekly rent, tenure, landlord type, and affordability indicators in the first release. It is the only dataset that provides standardised affordability data for every small geographic area in Australia.
What is Australia’s housing supply shortfall?
AMP chief economist Shane Oliver estimates a cumulative dwelling deficit of 200,000 to 300,000 homes. The National Housing Supply and Affordability Council projects only about 980,000 new homes will be delivered in the five-year period to mid-2029, against a 1.2 million target. That is a shortfall of roughly 262,000 dwellings. Net overseas migration reached approximately 420,000 in the year to September 2025, outstripping new home completions by about three to one.
How does household formation affect housing demand?
Household formation, the average number of people per dwelling, is a demand multiplier that operates independently of population growth. Between 2016 and 2021, Australia’s average household shrank from 2.6 to 2.5 people, a 0.1 shift that alone created demand for roughly one million extra dwellings. Single-person households rose from 24.4% to 25.6% of all households. If the 2026 Census shows further shrinkage, housing demand will be structurally higher than headline population figures alone suggest.
What does the Census reveal about renting in Australia?
The 2026 Census will provide the most detailed national picture of Australia’s rental market, distinguishing between six landlord types: real estate agents, public housing, community housing providers, relatives, other private landlords, employers, and residential park managers. With Greater Sydney’s renter share reaching nearly two in five households and the national outright ownership rate having fallen from over 40% in 1996 to 31% in 2021, the census will document whether the long-term shift from ownership to renting has continued. Sydney’s median rent reached $800 per week in June 2026.
How much is Australia’s housing market worth in 2026?
The total value of Australian dwellings reached $12.77 trillion in the March quarter 2026, up $316 billion in the quarter but with growth decelerating. The mean home price surpassed $1.1 million for the first time. The national median dwelling value sat at approximately $940,048 in May 2026, representing an 8.6% annual increase. The market is roughly seven times the value of all household bank deposits.
Where are Australians moving within the country?
Internal migration data embedded in the census will show the post-pandemic population shift away from Sydney and Melbourne toward Brisbane, Perth, Adelaide, and regional centres. Regional hotspots include Port Macquarie, Hobart, Bendigo, outer Melbourne growth corridors, and South East Queensland. The 2021 Census captured the initial pandemic-driven exodus to regional areas. The 2026 count will reveal whether those moves were permanent and whether affordability pressures in mid-sized capitals are now triggering a second wave.
How are Australians feeling financially ahead of the 2026 Census?
A Money.com.au survey conducted just before census night found that 52% of Australians expect the census to document their household as financially worse off than five years ago. Only 16% said they are better off. Housing costs are the dominant concern: 59% say rent or mortgage costs have escalated far beyond expectations since 2021. Gen X is the most pessimistic cohort, with 60% expecting financial deterioration and 67% reporting housing costs rose more than they budgeted for. Sean Callery, Head of Insights at Money.com.au, noted that the census will provide the data to confirm or counter these perceptions.
How accurate is Census housing data for regional mining communities?
Mining towns argue the census systematically undercounts their populations. Kalgoorlie-Boulder’s Mayor Glenn Wilson estimates roughly 10,000 FIFO workers use local housing and services but list their primary residence in Perth or other capitals, creating “ghost populations.” The ABS uses a “usual residence” test requiring six months or more at a location, an internationally standard approach that regional councils say understates the strain on local infrastructure. The Australian Mining Cities Alliance, representing towns including Mount Isa, Broken Hill, Karratha, and the Pilbara, argues the resulting funding allocations fall well short of real demand on the ground.
Conclusion
Tonight’s census forms capture a single date in a housing market that is already shifting. By the time the data arrives in June 2027, the V-shaped trajectory KPMG forecasts may already be playing out.
What the census provides is not a forecast but a benchmark: the most comprehensive, standardised housing dataset Australia produces. The forms being filled out right now will shape infrastructure funding, electoral boundaries, and housing policy for the rest of the decade. The wait for the numbers begins tonight.